
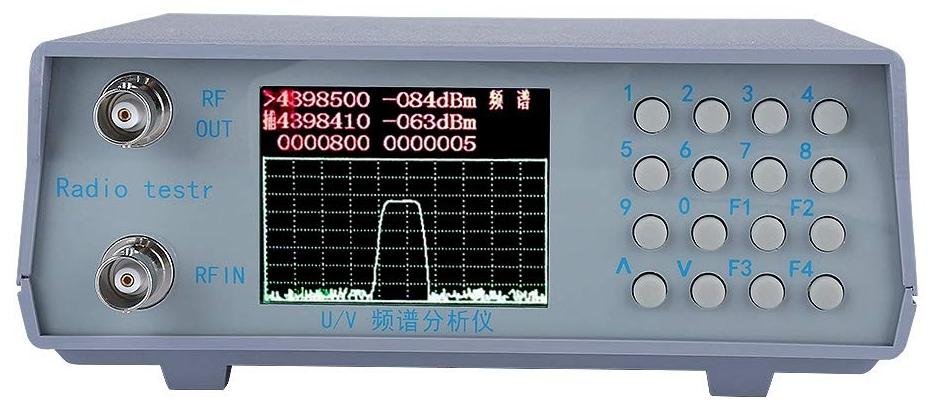
Using a Chinese radio testr spectrum analyser and tracking generator
Radio testr? Surely radio tester? No, really. Globalisation means you can get electronic gizmos from China at a fraction of the price they used to be, the march of technology means that things that used to be the province of 19” rack units can be approximated with DDS and microcontrollers. After a fashion. Here we have a small Chinese spectrum analyser and tracking generator, covering the amateur 2m and 70cm bands. This article is a quick run through it’s capabilities and limitations, followed by a run through how to use it to set up a 2m filter.
You can buy one of these on Amazon at varying prices above and below £100 or you can look it up on Banggood on your direct-from-China service of choice.
Agilent and Tek don’t need to be too worried quite yet. The device is quirky as hell and needs a fair amount of awareness to be able to use at all. Familiarity with having used a professional spectrum analyser and tracking generator is probably a plus ;) There is no manual, indeed you do not even get a power supply, so you are on your own. At least the socket is labelled 12V and it is the normal polarity. But you can’t argue with the price… It’s billed as
U/V UHF VHF Dual Band RF Spectrum Analyzer 136-173MHz/400-470MHz Radio Spectrum Analyzer with Tracking Source
Pinfold investigated this and they have a good page introducing you to it, with a look inside. It appears this is based on a VHF/UHF transceiver chipset.
That limits the range of the tracking generator, a general purpose spectrum analyser and tracking generator this is not. However, provided you know its limitations you may be able to use this to tune filters and the like. Let’s take a look at how to use this. Since this calls itself a radio testr I will run with the title ;)
Spectrum analyser
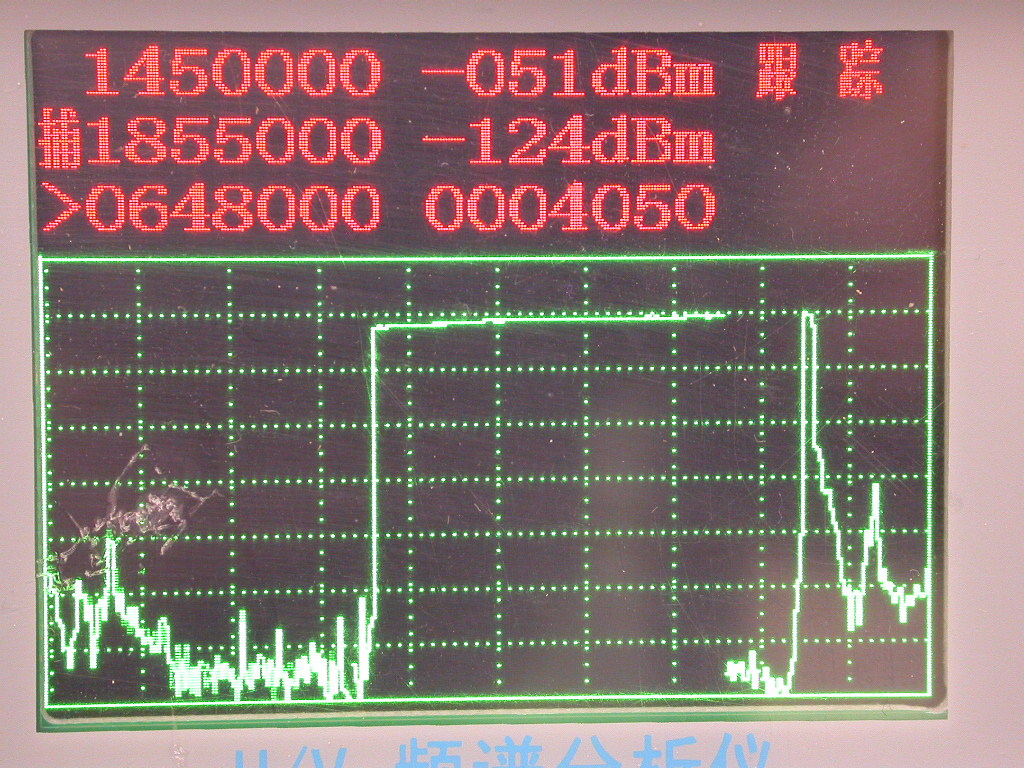
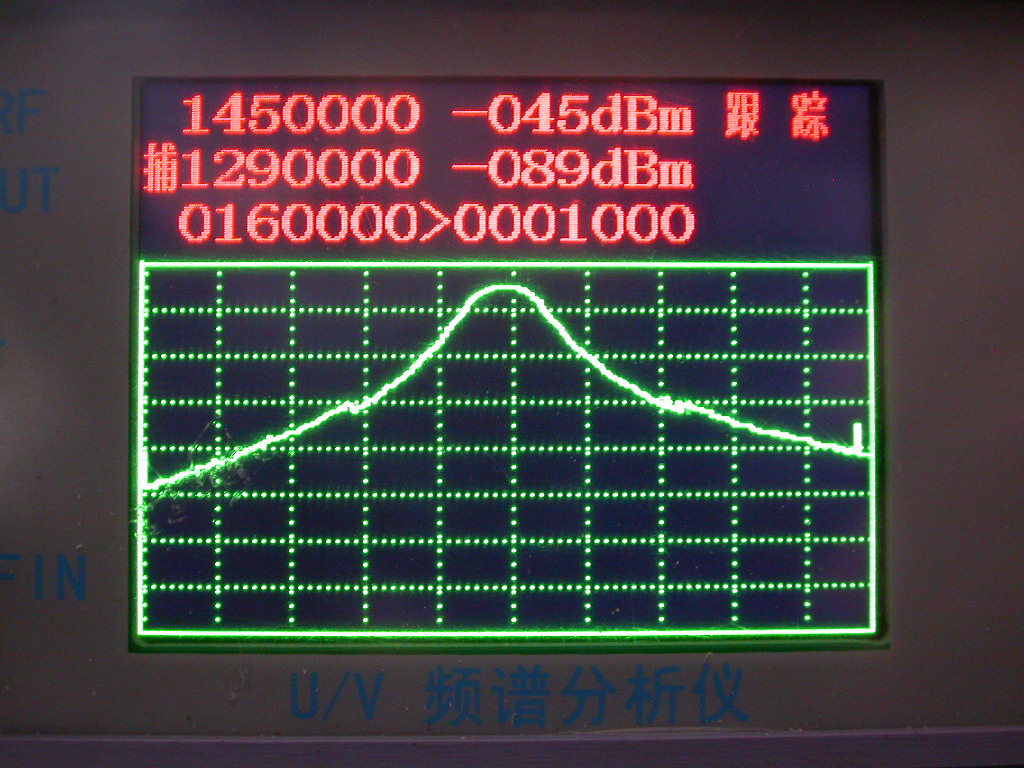
Here is a 140MHz signal presented to the testr.
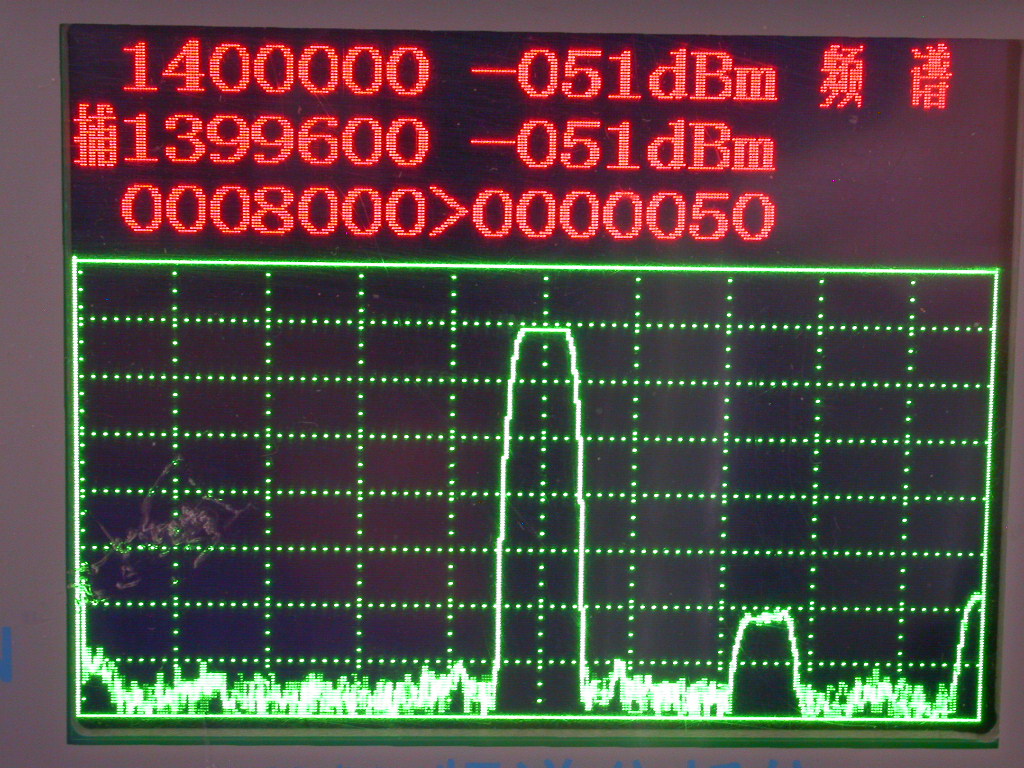
Top left shows 1400000 in red. This is the centre frequency, in tens of kHz. As I said, the unit is quirky. That is the frequency of the peak in the middle of the screen. You do not have any control of levels, so you need to have a set of external attenuators to adjust what on a normal spectrum analyser would be called the reference level. In all fairness on a HP spectrum analyser the adjust reference level control is an attenuator, you can hear the relays clicking, though there may be more fine control of the IF amplifier. With the radio testr you get to bring your own attenuator. Saves money that way…
What you need to know is that the testr cannot handle a signal level that is greater than -50dBm on the display in analyser mode. Keep all signals presented to the testr one coarse graduation below the top of the graticule, as shown. Why?
The front end is wideband, so you should make sure no signal going in is above this level, even if it is off the screen. The two Chinese characters on the top right of the first line tell you if the unit is in spectrum analyser mode or SA + tracking generator mode. This is in analyser mode. You change modes by a long press of the F1 key. That switches on the transmitter, which is presented on the top BNC socket. If you simply want the spectrum analyser mode turn it off, you don’t need the stray RF. I do not know what the second line is telling me. The third line shows 0008000 on the left. The > sign points to what I can adjust, using the up and down keys on the keyboard. Up lowers the value, down raises it. Go figure. 8000 is the distance from the centre of the screen to the left-hand side, or right-hand side, in kHz. In a normal analyser that would be called span. Although you can put the cursor to change this, using F1, it is best used as a read-only value. In this case it tells me the span is 16MHz. That is simply 2*8MHz, twice the distance from the centre of the screen to either side.
The span is typically 160 times the next value, which is settable as described above, if the > arrow has been moved to point to it. I would hazard a guess that this is what would normally be called IF bandwidth. The span increases and shrinks linked with this setting, although you can increase the span a couple of steps independently
Pressing F1 repeatedly cycles between setting the centre frequency (top left value), the span, and what I have called IF bandwidth. Since the entire span is 16MHz and the spread of what should be a single tone is about 1/20th of the screen, the effective IF bandwidth seems to be about 800kHz.
Tracking generator
The tracking generator needs care in use, because it is possible to set the span of the analyser outside the working range of the generator. This leads to bizarre responses that look like a brickwall filter, which are merely the generator switching on and off.
To enable the generator observe the lower right hand corner of the last Chinese character of the first line. It sort of looks like a ladder. Long press F1 until it doesn’t look like a ladder, see below. The tracking generator is now on.
Bearing in mind that the receiver cannot handle large signals, to do a through test from generator to analyser you need roughly 15dB of attenuation. That needs to be between the top BNC, which is the output of the tracking generator, and the lower BNC, the input to the receiver. If you simply connect them straight through the signal is off the top of the scale and not visible. Although it looks a pain, this is quite smart as the radio testr can deal with filters that have up to 15dB of loss without amplification, and wideband flat frequency response loss is easier to be had that wideband flat response amplification. If you have the choice split the attenuation between top and bottom, eg use a 6dB on the output of the tracking generator and 10dB on the input to the analyser.
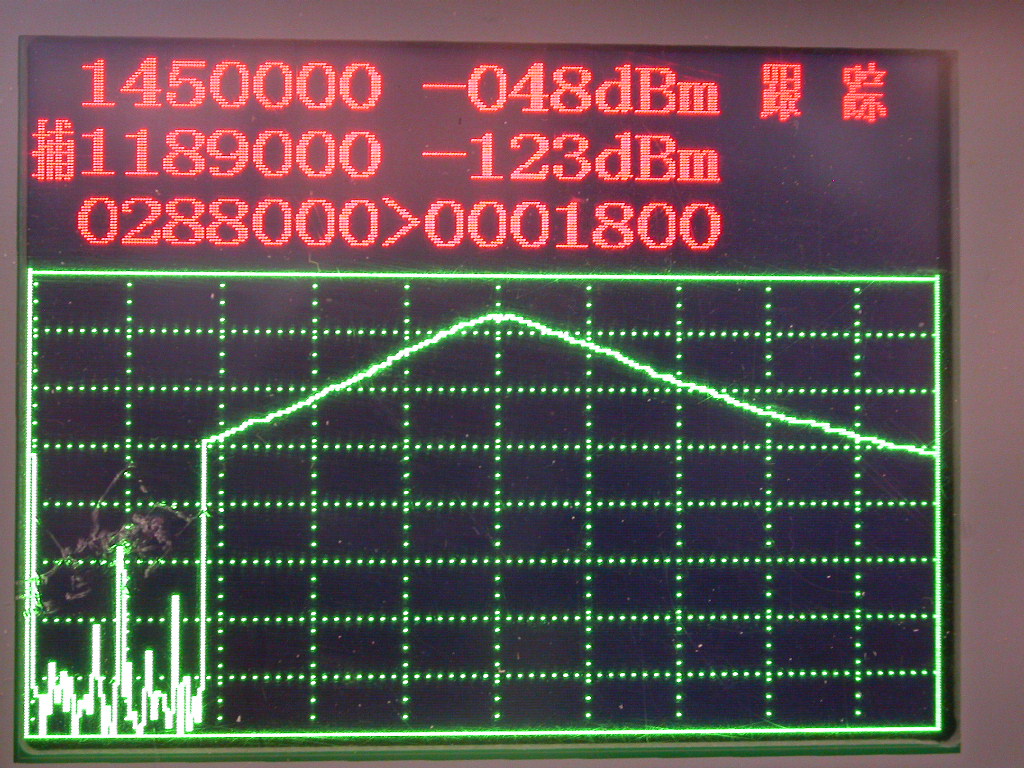
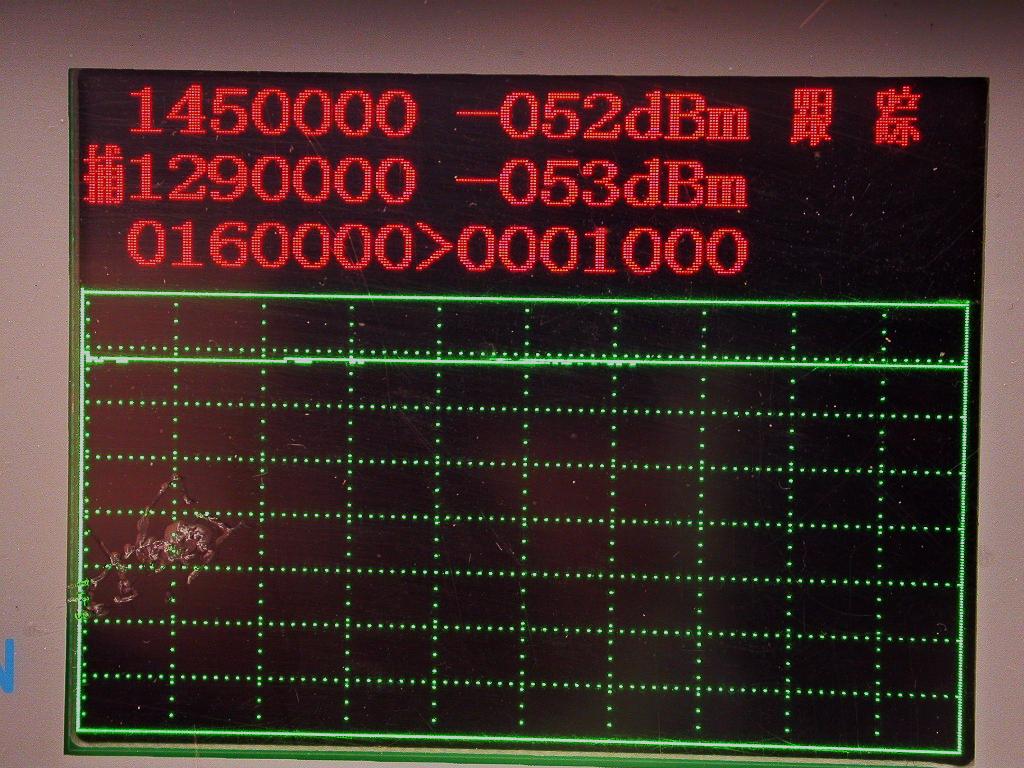
The tracking generator, being the guts of a transceiver, will not cover as much range as the receiver. It is always worth doing a through test first. For instance the next trace
shows that the tracking generator just can’t cover the range 80MHz to 210MHz. The device under test is a straight through connector with about 20dB attenuation. It is not a brickwall filter - the TG only comes online at about 130MHz. It cuts out about 180MHz, comes back again and then dies. Bearing in mind that the TG is the transmit part of a VHF/UHF transceiver, that is not unreasonable.
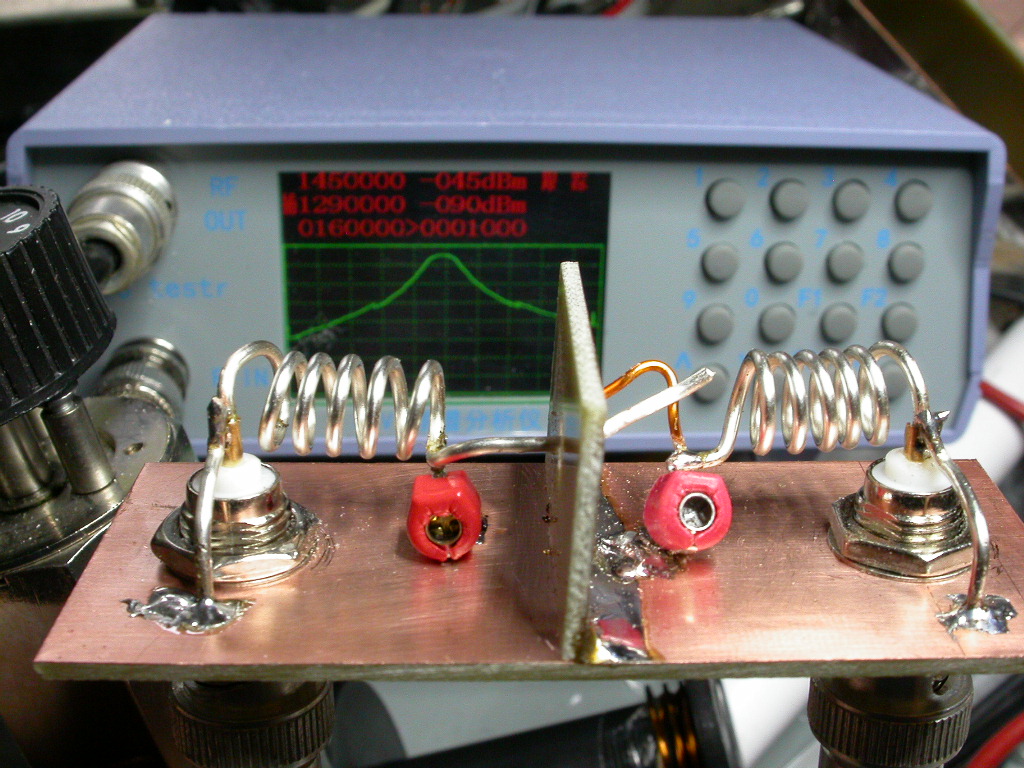
Using the radio testr to make a 2m helical filter
I would say as a filter design/adjustment tool this device is well suited to narrowband in band filters. It’s not so well suited to building band-reject filters, eg trying to reject the FM broadcast band, because you can’t get the tracking generator to ouptut signals in the 88-108MHz band. However. I will show using it to characterise a homebrew 2m filter. This is roughly created after this design, but I have no experience of creating helical filters, and the design information is not precise, inasmuch as there is no drawing. It is apparently crafted after the RSGB VHF/UHF manual of old.
The grass in the display is about 10dB higher with the tracking generator on. I looked, but did not find obvious signs of the overload I saw on the signal generator at the -40dBm reference level at the top of the screen, so I have assumed there is 10dB attenuation added when the TG is on. This would seem to be a wise thing to do to protect the front end, and would appear as a higher noise level.
I therefore lined up the TG, through a 10dB in 1dB step attenuator and a fixed 6dB attenuator in series. I put the 10dB attenuator before the filter and the 6dB attenuator after it, which will help keep the terminations closer to 50Ω
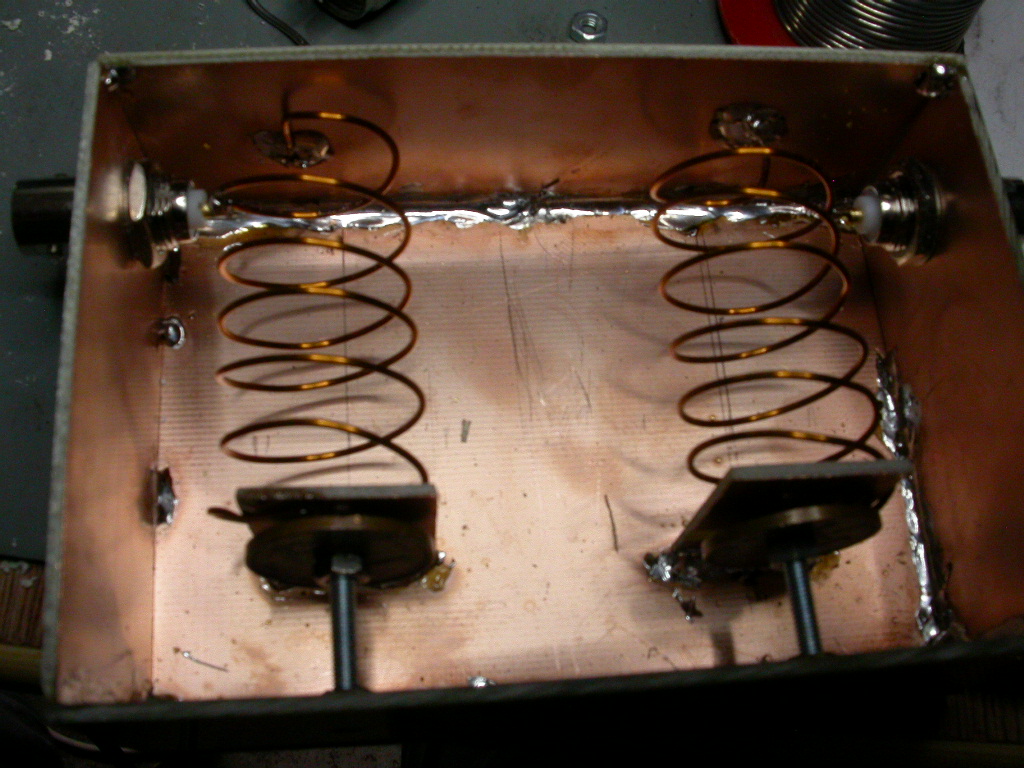
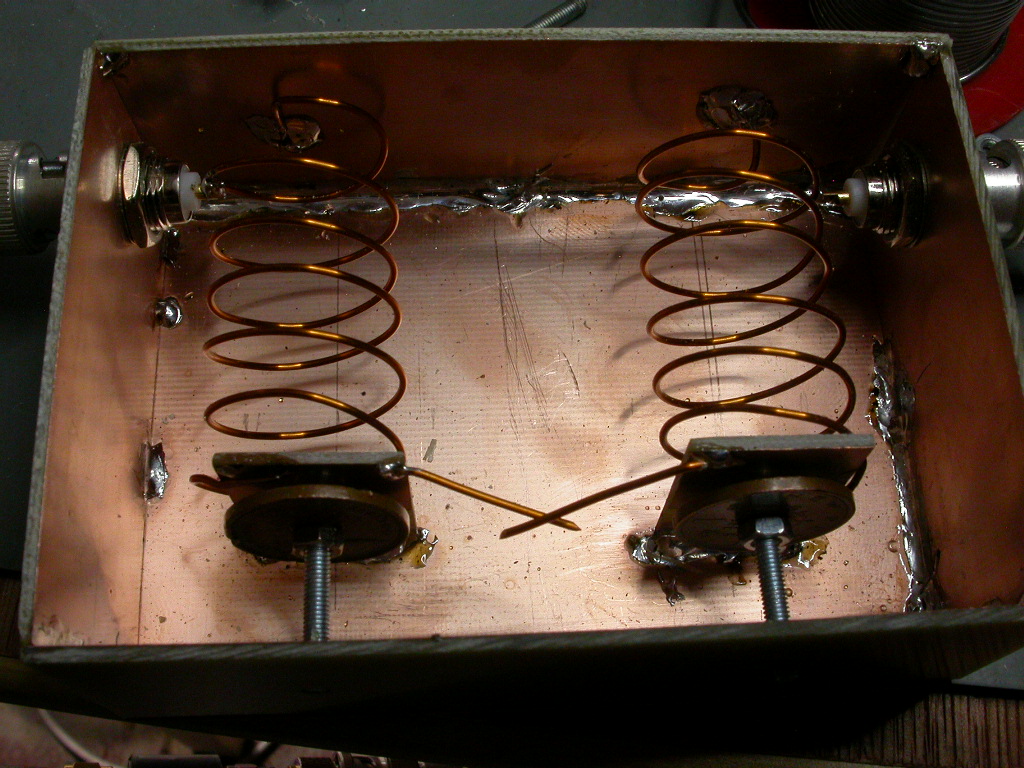
I constructed the filter using PCB material, I suspect I do not have enough top coupling between the coils and you can see there is proportionally more gap between my coils and those in the original. But it will suffice to show the radio testr in action.
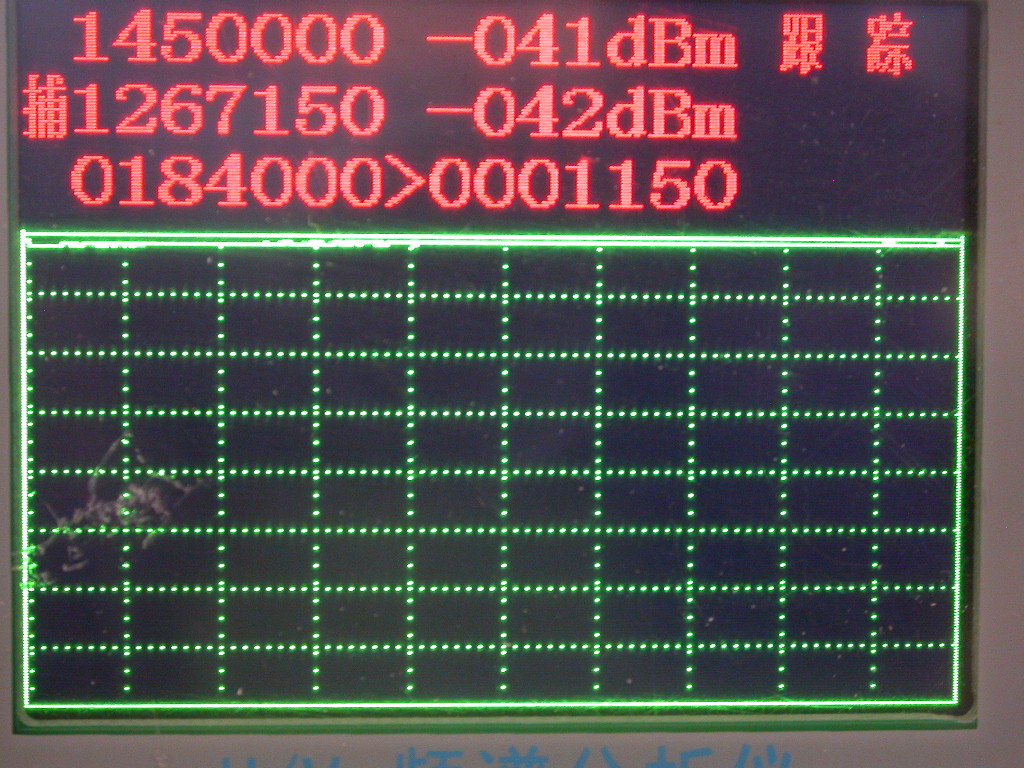
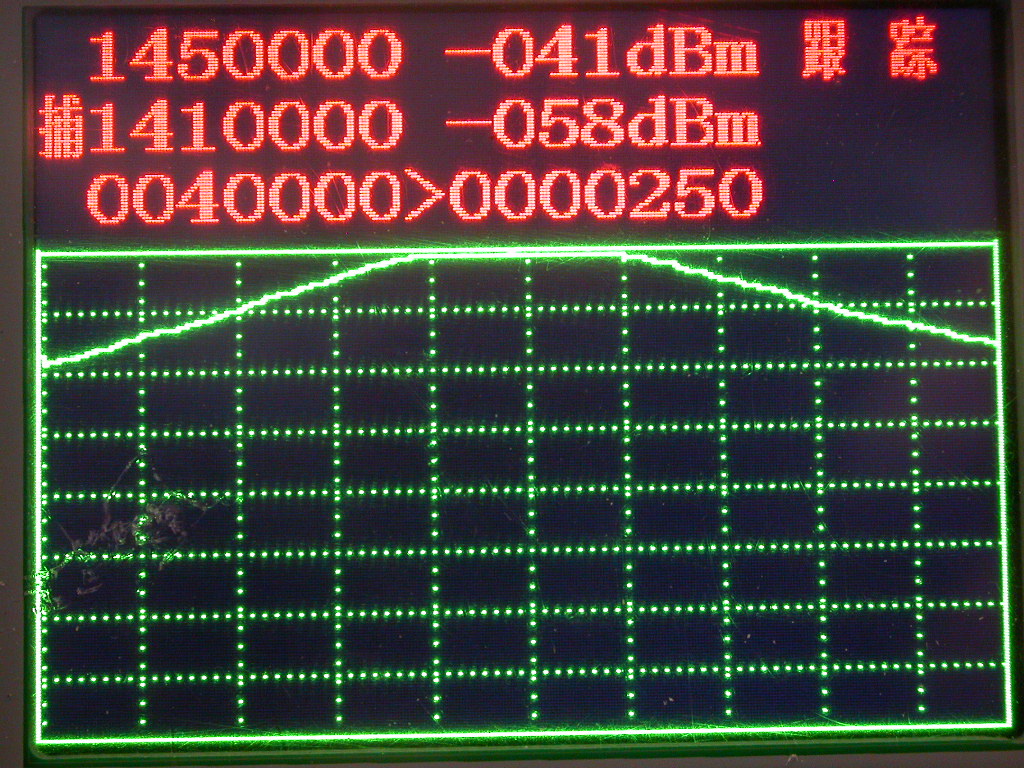
First I replace the filter with a through BNC barrel, and baseline the response, adjusting the attenuators to just come off the top line. I am lined up at -41dBm.
I now substitute the filter for the BNC through barrel, and observe the response.
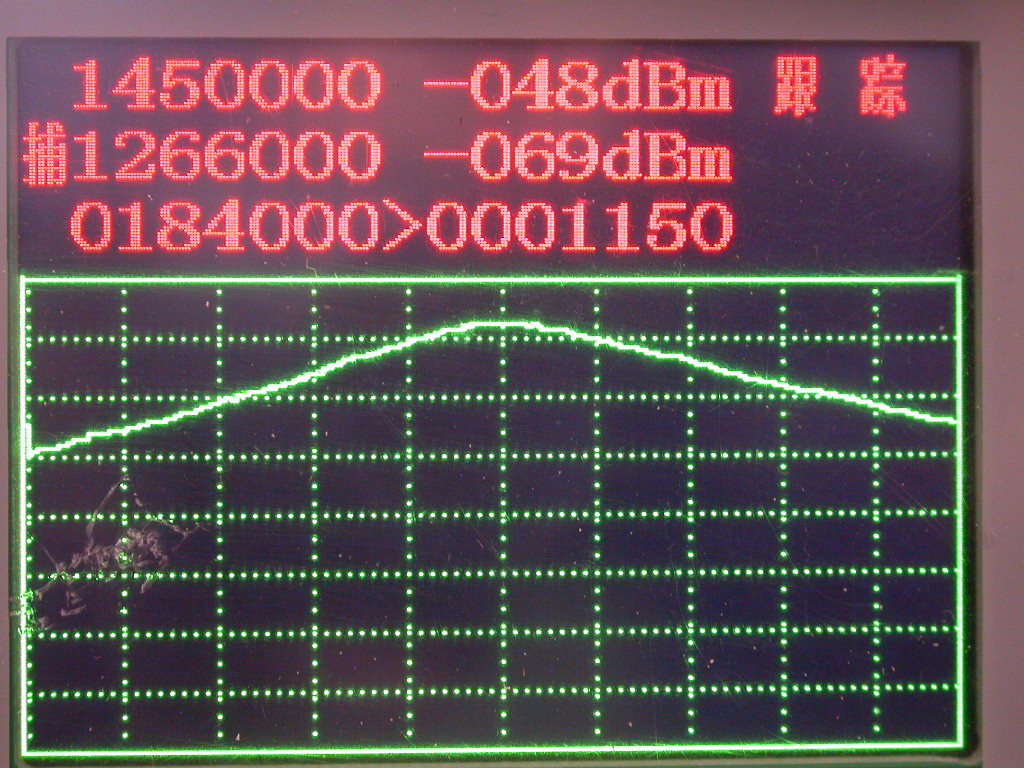
I adjust the capacitors for 145MHz, because I cannot overcouple the filter I suspect a shortage of top coupling and this squares with the through loss. I observe now, that my centre frequency loss is about -7dB. I have the choice, saw the box in half and make the coils closer to each other and solder it together, or add a gimmick1 to improve the top coupling, though it also adds a teeny bit of parasitic inductance. I go with the gimmick.
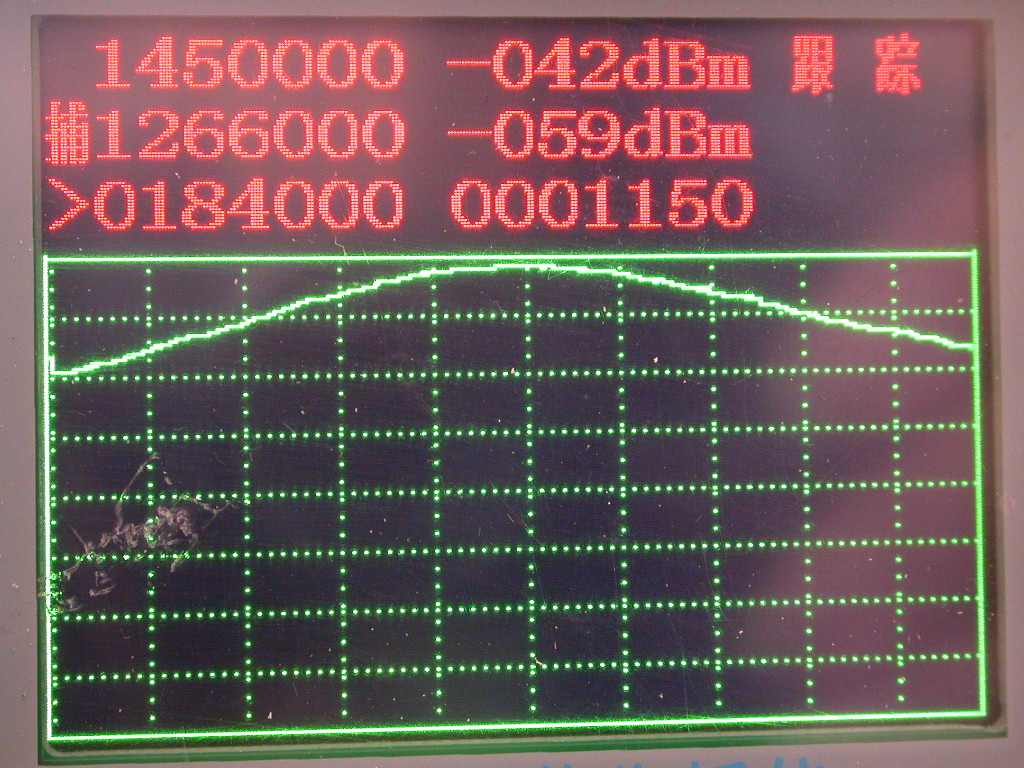
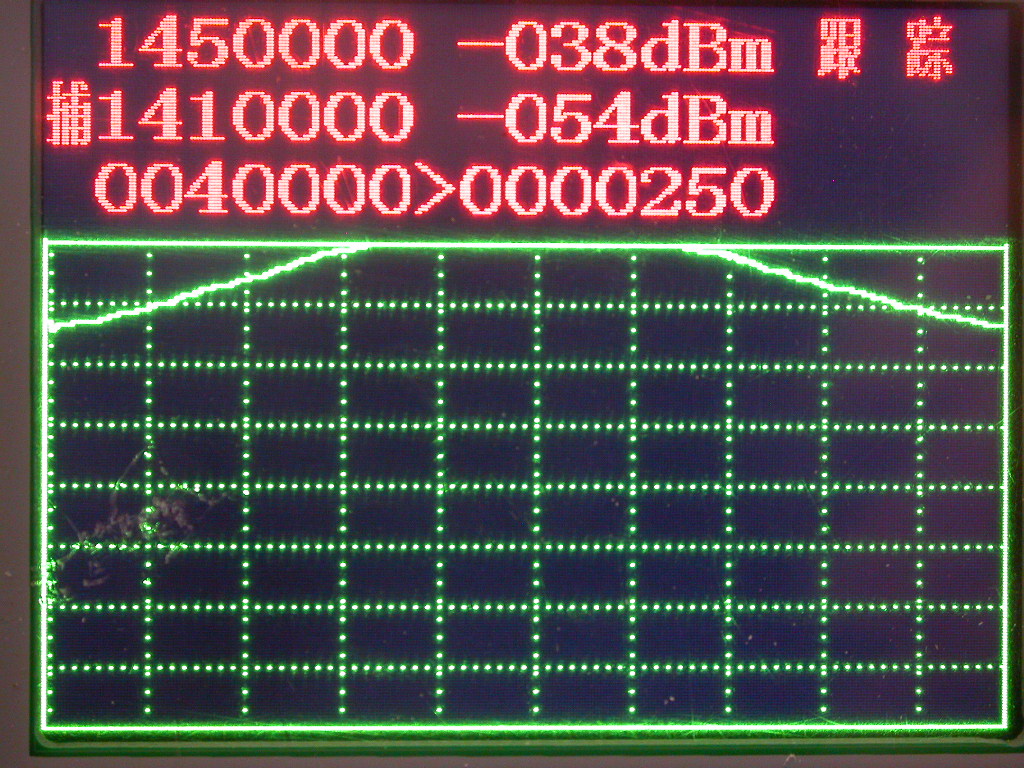
My filter response improves, through loss is now about 1dB, which is more respectable and now within the experimental error of this sort of test kit, putting the through barrel again confirmed the original line-up level of -41dB. I am probably 16dB down at the +/- 18MHz mark.
G. R. Jessop2 wouldn’t approve of such a slovenly implementation. This design is sort of swiped from his 70cm filter, he achieves -20dB +/- 8MHz of his 433MHz centre frequency, scaled to 2m that would be 2.7MHz either side.
My construction is sub-optimal. The enamelled wire reduces Q, the soldered box reduced Q, I should have used thicker silver plated wire. Jessop built his into a brass box.
Improving the filter
The obvious place to improve this is in the coils, so I made them a lot smaller and used 1.25mm silver-plated wire I had left over from a homebrew ATU.
This behaves more like it, and is much smaller as an added bonus. Rather than tap the coils, which gets fiddly on smaller coils, I took a hint from W7ZOI’s “The double-tuned Circuit: An experimenter’s tutorial” 3 and used short lengths of wire for the lowest turns. Wire is 1.25mm diameter, coils are 6t on a 6mm dirll as former. Trimmers are Murata red 5.5-20pF.
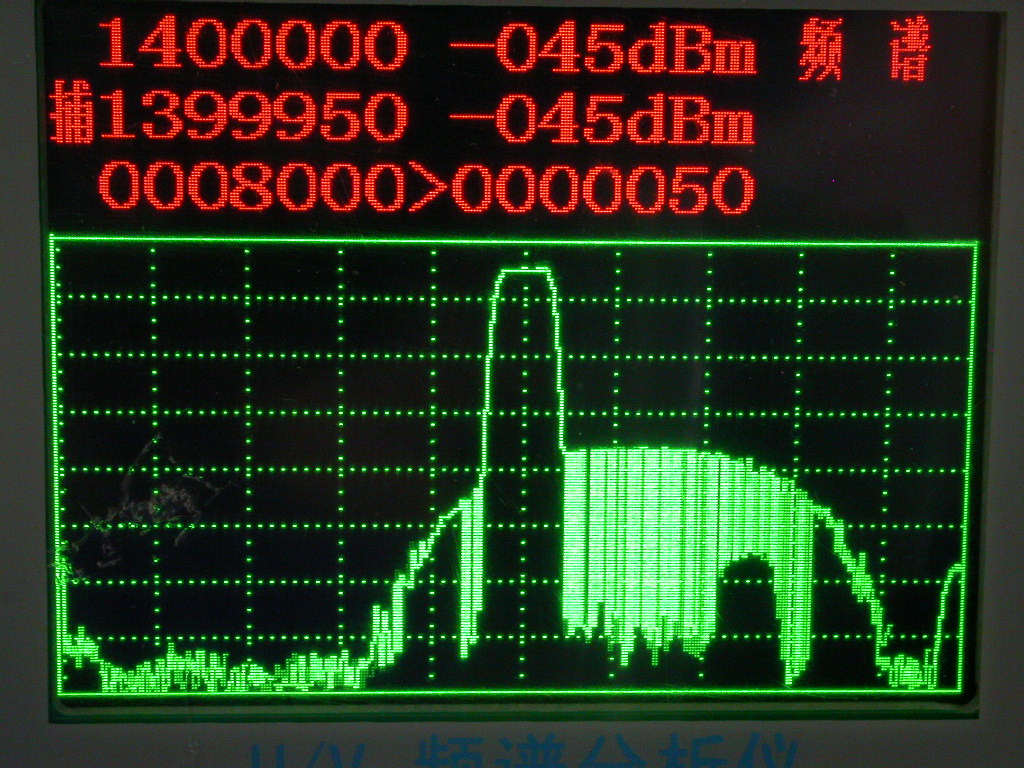
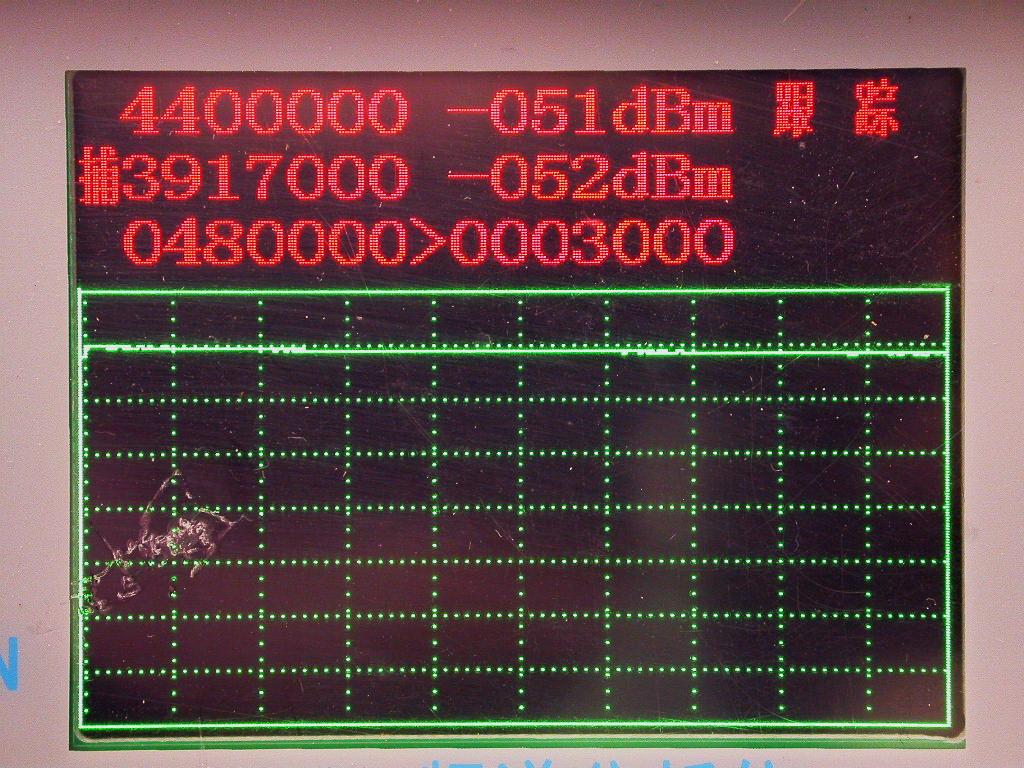
AT +/- 16MHz I am 30-40dB down, more on the LF end because of the capacitive coupling. I have to eat a 4dB loss in the passband. To find out the -3dB points I use an indirect method, first adjusting the attenuator to normalise the response to the top level
and then take 3db out of the attenuator
I have about 8MHz of total span, so 0.8MHz per coarse dvision, and about 3 coarse divisions of passband, so a 2.4MHz passband. Looking at the wider 32MHz span plot I have about 10MHz to the -20dB point. This is considerably better than the first attempt.
This article shows the use of this device, however, to set up a 2m filter. The radio testr was up to the task, provided you stay aware of its limitations. They are quite severe, but you aren’t paying HP/Agilent prices!
Richard G7LEE
-
In valve radio days a gimmick was a low-value trimming capacitor made by twisting a two pieces of insulated wire together. ↩
-
VHF-UHF Manual, G.R. Jessop, publ RSGB 1969, Chapter 4 fig 4.7 ↩
-
The double-tuned Circuit: An experimenter’s tutorial, Wes Hayward, W7ZOI. QST December 1991, p29ff ↩